Published on
Thursday, April 27 2023
Authors :
Harld "Skip" York
Questions surrounding EPA’s proposed CO2 vehicle standard
I wonder if “There is no magic in magic” is what Walt Disney would have thought as he read the Biden administration’s announcement of the strictest restrictions on auto emissions ever. The policy intent of this proposal is to rapidly accelerate a transition to electric vehicles. Manufacturers can choose their preferred technologies to comply with standards so the pathway described by EPA could be just one possible outcome for the industry.
The most aggressive option EPA laid out could lead to 67% of all new light duty car and truck sales being electric by 2032; up from an assumed 36% in MY2027, and 7% in 2022 (see Table 1). How aggressive is this pathway? In March the Energy Information Administration forecast EVs would make up only 15% of sales by 2030.
Table 1: Fleet BEV Penetration Rates, by Body Style
| 2027 | 2028 | 2029 | 2030 | 2031 | 2032 | |
| Sedans | 45% | 53% | 61% | 69% | 73% | 78% |
| Crossovers/SUVs | 38% | 46% | 56% | 59% | 61% | 62% |
| Pickups | 11% | 23% | 37% | 45% | 55% | 68% |
| Total | 36% | 45% | 55% | 60% | 63% | 67% |
Source: “Multi-Pollutant Emissions Standards for Model Years 2027 and Later Light-Duty and Medium-Duty Vehicles” Table 80.EPA
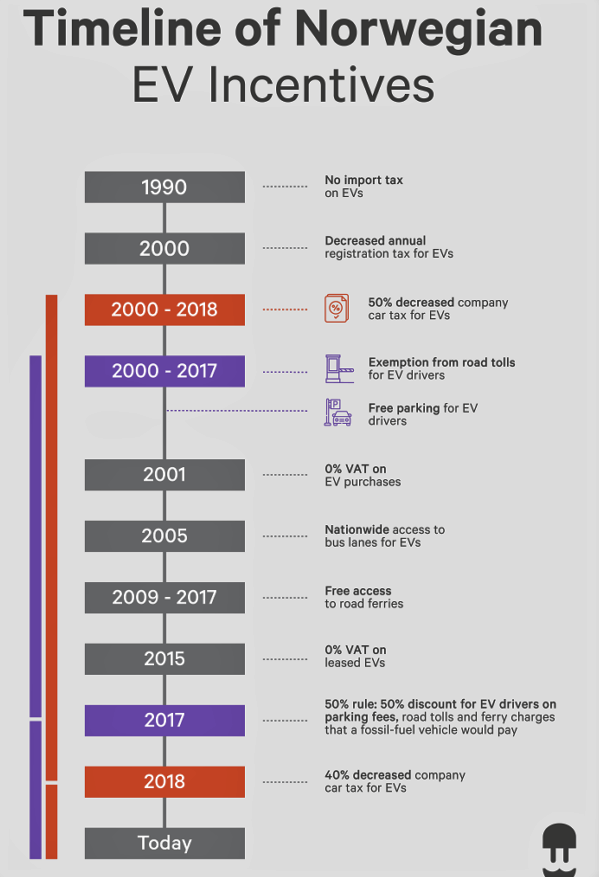
Another way to put this pathway to 2032 in perspective, is that in 2013 Norway’s EV sales share (6.1%) was similar to the US in 2022. By 2020 (equivalent to MY2032), it’s EV sales share bloomed to 75%. The rapid penetration of EVs in autos sales in Norway was driven by a vastly different policy history than the path proposed by EPA. Norway’s EV incentive policies started in 1990 (see Figure 1). Over the next 30 years policy was focused on closing the gap between the sales price of ICE and EV vehicles. The cumulative impact of these policies is that some EV models are now cheaper than the ICE equivalent. For example, the net-of -policy price of the ICE version of the Volkswagen Golf is $40,175, while the e-Golf is $27,775.
Besides rolling out EV purchase incentives, Norway also enhanced EV utilization by being a pacesetter in charging infrastructure investment, with power supplied from their abundant hydroelectric resources. While Norway’s population makes up about 1% of the EU’s, the country’s public charging points are equal to almost 8% of the EU’s public chargers. EV charging is about three times longer than filling an ICE fuel tank; although EVs do have the option of charging overnight while you sleep.
There are three main take-aways from Norway’s EV approach: (1) incentives focused on making EV pricing comparable to ICE vehicles initially boost adoption rates, (2) these measures can be instituted over time and adjusted to meet policy goals, and (3) there are a variety of EV incentives that can be effective alternatives to direct monetary grants.
Figure 1: Evolution of Norway’s EV Sales
How likely is the EPA’s proposal to repeat the Norway experience?
The Alliance for Automotive Innovation notes that even with growing EV sales momentum, and the global auto industry EV platform investments of $1.2 trillion by 2030, the required electrification would require a massive shift in the US industrial base and American driving habits that have evolved over the last 100 years.
One change in habits is establishing the convenience of reliable and readily available charging stations, similar to what ICE drivers have today with service stations. S&P Global estimates the US will need 2.3 million public charging stations by 2030 (up from 100,000 today), while McKinsey & Company estimates such a network would require $35 billion. The Biden Administration has committed up to $7.5 billion in EV charging infrastructure funding, which is about 20% of required investment.
Even with sufficient charging locations, widespread adoption rests on EVs becoming competitively priced with mainstream ICE vehicles. In 2022, the average ICE automobile price was $44,000, but for EVs it was $66,000.
The EPA assumes EVs will become more affordable as manufacturing costs, particularly batteries, decrease over time. The agency estimates EV battery costs will drop about 50% by 2035. This cost compression would be driven by a return of a manufacturing learning curve, which has been mostly flat for the last 4-5 years. However, as Table 2 shows, the EPA also assumes the average cost of manufacturing emission compliant vehicles rises about $1,200 (relative to taking no action) by 2032. The surge in incremental cost beyond 2030 appears at odds with the assumption of falling battery costs. The table also implies that purchase prices would be even higher for buyers that do not qualify for the $7,500 30D tax credit.
Table 2: Average Incremental Vehicle Cost by Body Type – U.S.$2020
| 2027 | 2028 | 2029 | 2030 | 2031 | 2032 | |
| Sedans | $181 | $79 | $51 | $194 | $695 | $1,015 |
| Crossovers/SUVs | $657 | $448 | $332 | $487 | $804 | $962 |
| Pickups | $1,374 | $1,478 | $1,333 | $1,324 | $1,574 | $2,266 |
| Total | $633 | $497 | $401 | $526 | $866 | $1,164 |
Source: “Multi-Pollutant Emissions Standards for Model Years 2027 and Later Light-Duty and Medium-Duty Vehicles:” Table 78, EPA
These cost estimates do not include potential price inflation for critical battery components, such as copper, nickel, cobalt, graphite, and lithium as the Energy Transition drives greater electrification across the world. Using estimates from Tesla and Benchmark Minerals Intelligence, the cost of incremental mining and mineral refining could add another $850 to $1,250 to the cost of an EV. To qualify for the 30D tax credit, these batteries would need $25 – $35 billion of mining and processing investment in the US.
If enacted, the EPA standards would surpass those already in place in the European Union. One unintended risk could be automakers choosing a narrowing set of compliance options, which might limit innovation and technological progress.
For these policy paths to be plausible, it seems they need complementary strategies in permitting reform, enhancing supply chains, and support for domestic manufacturing that does not violate international trade agreements. With all these uncertainties several questions come to mind:
| • | How plausible is it that EVs could reach 36% in just a few years? | |
| • | Can battery costs keep decreasing given that materials make up about 80% of the manufacturing costs? | |
| • | Would this pathway result in additional EV sales on a global basis or merely shift sales to the U.S. from other countries, if battery material supplies are constrained? |